Which Class Had The Best 2017 NCAA Tournament?
Which Class Had The Best 2017 NCAA Tournament?
We examined the results of the 2017 NCAA Wrestling Championship to determine which class, either the freshman, sophomores, juniors, or seniors, had the best tournament.
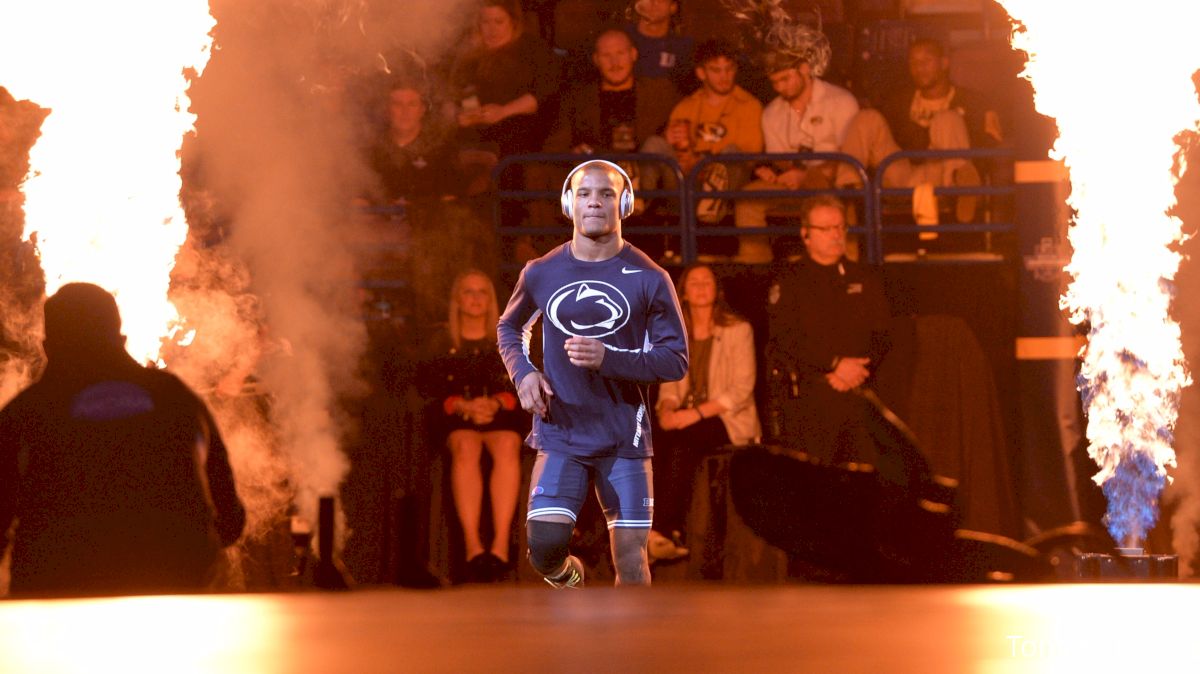
Freshmen were first eligible to compete in the NCAA Championships in 1969, and ever since we've been able to compare how all four classes have fared at the big dance.
With four Penn State underclassmen winning individual championships, it certainly appears that 2017 was a good year for freshmen and sophomores. But just how good was it? And how did the other classes do? We take a look at the number to find out.
Before getting into the pie charts and graphs, you can count up the raw numbers from the 2017 NCAA tournament here.
For this particular analysis, we assigned NCAA placement points to each place-winner to provide more context and added up the total points scored in this manner by each class of eligibility, just like we did for our analysis of conference performance.
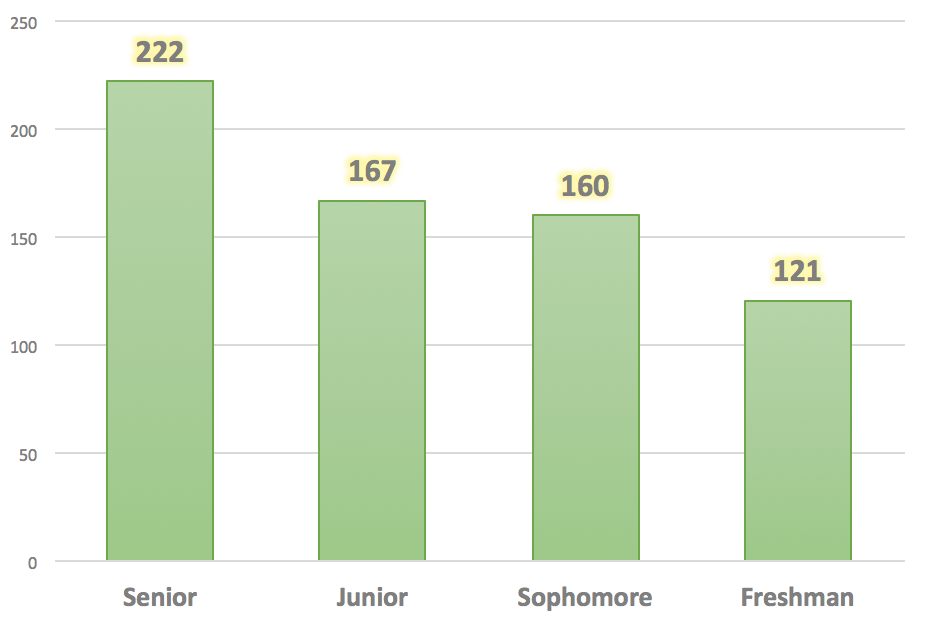
Unsurprisingly, the senior class scored the most number of placement points, followed by the juniors, sophomores, and frosh, in that order.
The sophomores appear to have done particularly well, though, as they nearly matched the placement points scored by the juniors. The pie chart below shows the same data from a slightly different perspective.
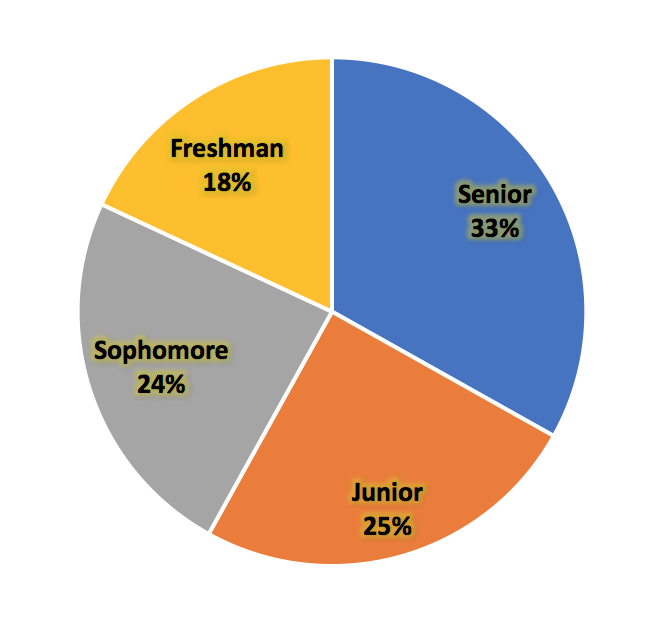
It's also interesting to see the sophs and juniors take up almost half the entire available placement points, with the seniors and freshman combining for just over one-half.
To get a better idea of how those numbers compare historically, we took the average placement points scored by each class from the previous 10 NCAA tournaments from 2007 to 2016.
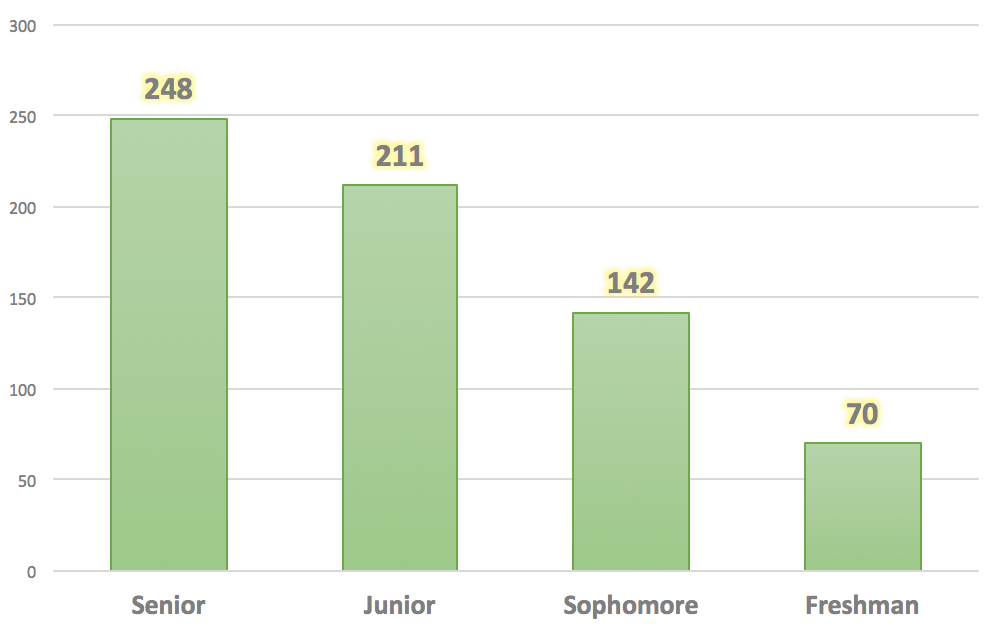
When more years of results are considered, we see a more steady and linear increase in points scored occurs as we go up in classes. This is to be expected, as wrestlers physically mature and benefit from additional years of high-level training.
Each additional year in a college room is worth about 70 extra points at the NCAAs for the class as a whole, except for the jump from junior to senior year, which is a smaller increase of fewer than 40 points.
We can also look at the same data from the new perspective of a pie chart.
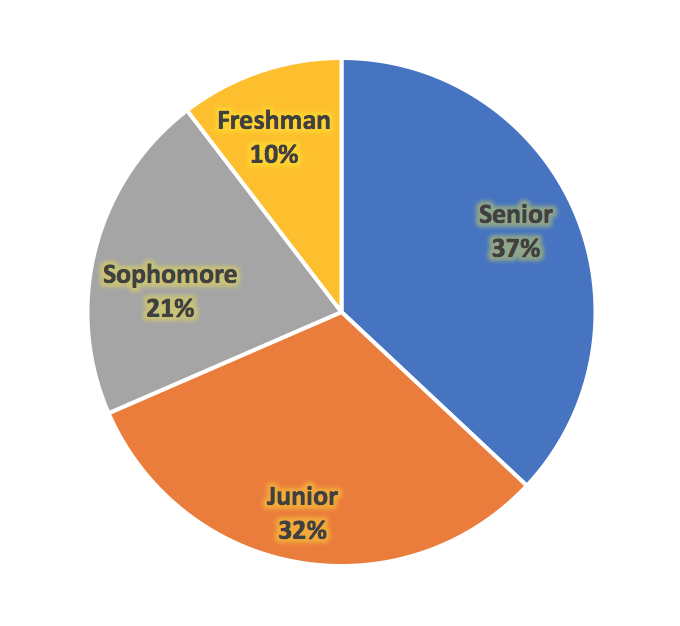
The total points are once again close to evenly split between two groups -- the freshman and seniors on one side and the sophomores and juniors on the other.
By now it is also obvious that the freshman and sophomore classes outperformed their historical average at the 2017 NCAA tournament, at the expense of the juniors and seniors.
We can see by just how much they do by comparing the 2017 results to the 10-year averages and ranking our classes in order.
Total Points By Class -- 2017 Compared to 10-Year Average
Percentage Of Total Points By Class -- 2017 Compared To 10-Year Average
Penn State is definitely helping lead this youth movement, with two freshman and two sophomore champs. Michigan also did their part, notching three freshman All-Americans, the most of any school. Penn State and Oklahoma State were tied for the most sophomore All-Americans with three apiece.
You'd have to drill down further to make sense of what, if any, specific trends are driving these results. It could just be some random noise in the data, and that if the 2017 NCAAs were hypothetical re-wrestled, we'd see results more more in line with historical averages.
Or we could have a very special freshman class on our hands. There's no to be sure at the moment, but it's worth keeping in mind as this freshman class works its way through its four years of eligibility.
In the meantime, below is Penn State's super frosh Mark Hall, upsetting Ohio State's upperclassman Bo Jordan in the 174 finals of the 2017 NCAAs.
With four Penn State underclassmen winning individual championships, it certainly appears that 2017 was a good year for freshmen and sophomores. But just how good was it? And how did the other classes do? We take a look at the number to find out.
Before getting into the pie charts and graphs, you can count up the raw numbers from the 2017 NCAA tournament here.
For this particular analysis, we assigned NCAA placement points to each place-winner to provide more context and added up the total points scored in this manner by each class of eligibility, just like we did for our analysis of conference performance.
2017 NCAA Wrestling Championship Placement Points By Class Eligibility

Unsurprisingly, the senior class scored the most number of placement points, followed by the juniors, sophomores, and frosh, in that order.
The sophomores appear to have done particularly well, though, as they nearly matched the placement points scored by the juniors. The pie chart below shows the same data from a slightly different perspective.

It's also interesting to see the sophs and juniors take up almost half the entire available placement points, with the seniors and freshman combining for just over one-half.
To get a better idea of how those numbers compare historically, we took the average placement points scored by each class from the previous 10 NCAA tournaments from 2007 to 2016.
2007-2016 NCAA Wrestling Championship Placement Points By Class Eligibility

When more years of results are considered, we see a more steady and linear increase in points scored occurs as we go up in classes. This is to be expected, as wrestlers physically mature and benefit from additional years of high-level training.
Each additional year in a college room is worth about 70 extra points at the NCAAs for the class as a whole, except for the jump from junior to senior year, which is a smaller increase of fewer than 40 points.
We can also look at the same data from the new perspective of a pie chart.

The total points are once again close to evenly split between two groups -- the freshman and seniors on one side and the sophomores and juniors on the other.
By now it is also obvious that the freshman and sophomore classes outperformed their historical average at the 2017 NCAA tournament, at the expense of the juniors and seniors.
We can see by just how much they do by comparing the 2017 results to the 10-year averages and ranking our classes in order.
Total Points By Class -- 2017 Compared to 10-Year Average
- Freshman: +51
- Sophomore: +18
- Senior: -26
- Junior: -26
Percentage Of Total Points By Class -- 2017 Compared To 10-Year Average
- Freshman: +8
- Sophomore: +3
- Senior: -4
- Junior: -7
Penn State is definitely helping lead this youth movement, with two freshman and two sophomore champs. Michigan also did their part, notching three freshman All-Americans, the most of any school. Penn State and Oklahoma State were tied for the most sophomore All-Americans with three apiece.
You'd have to drill down further to make sense of what, if any, specific trends are driving these results. It could just be some random noise in the data, and that if the 2017 NCAAs were hypothetical re-wrestled, we'd see results more more in line with historical averages.
Or we could have a very special freshman class on our hands. There's no to be sure at the moment, but it's worth keeping in mind as this freshman class works its way through its four years of eligibility.
In the meantime, below is Penn State's super frosh Mark Hall, upsetting Ohio State's upperclassman Bo Jordan in the 174 finals of the 2017 NCAAs.