By The Numbers: The 2024 NCAA Wrestling Championships
By The Numbers: The 2024 NCAA Wrestling Championships
Breaking down the 2024 NCAAs with numbers and graphs and maps and positive vibes!

The NCAA Wrestling Championships is an unwieldy beast of a tournament. Three days, six sessions, 10 weights, 80 All-Americans, and nearly 1,000 matches. It is more than a lot of bite-off let alone chew. But we're here with stats, graphs, tables, and yes, heat maps, all to help you digest the sumptuous event we all enjoyed last weekend.
Previous NCAAs By The Numbers: 2023 | 2022 | 2021 | 2020 | 2019 | 2018 | 2017 | 2016 | 2015 | 2014
Our Award-Winning Live Blog: First Round | Second Round | Quarterfinals | Semis + Bloodround | Medal Round | Finals
More NC2A Tournament Content: AAs By HS Class | Updated Olympic Trials Qualifiers | A Simple Lst of All 80 All-Americans | Somehow Even More Content
Now let's get to the numbers, graphs, charts, maps, and positive vibes from the 2024 NCAAs!
All-Americans by Conference
Pretty self-explanatory.

To see how things have progressed in the post-covid era, I looked up AAs for each conference since 202. That table is below.
| CONFERENCE | 2021 | 2022 | 2023 | 2024 |
|---|---|---|---|---|
| Big Ten | 35 | 39 | 33 | 30 |
| Big 12 | 16 | 10 | 17 | 20 |
| ACC | 12 | 10 | 12 | 8 |
| Pac-12 | 8 | 13 | 7 | 9 |
| EIWA | 2 | 7 | 7 | 9 |
| MAC | 6 | 0 | 4 | 3 |
| SoCon | 1 | 1 | 0 | 1 |
Good year for the EIWA and the Big 12. Slightly down year for the Big Ten and the ACC.
All-Americans by Conference per School
Of course, some conferences have more schools than others, so I thought we'd divide those AAs by the number of schools in each conference. Those numbers have changed a bit over the years, as schools have switched conferences, for instance, UNI and Missouri went from the MAC to the Big 12, so hopefully my math checks out.
| CONFERENCE | 2021 | 2022 | 2023 | 2024 |
|---|---|---|---|---|
| Big Ten | 2.5 | 2.8 | 2.4 | 2.1 |
| Big 12 | 1.5 | 0.8 | 1.3 | 1.5 |
| ACC | 2.0 | 1.7 | 2.0 | 1.3 |
| Pac-12 | 1.6 | 2.6 | 1.4 | 1.8 |
| EIWA | 0.1 | 0.4 | 0.4 | 0.5 |
| MAC | 0.5 | 0.0 | 0.3 | 0.2 |
| SoCon | 0.1 | 0.1 | 0.0 | 0.1 |
If you see anything amiss, please let me know!
2024 NCAA Points per Conference
This year, I took the extra time to record exactly how many points each wrestler earned at the NCAAs, so placement, advancement, AND bonus points. I did not subtract the team points that coaches or wresters were penalized during matches, because A) that rules is dumb and B) it would have taken more time to figure out who should have been deducted what and this was already taking longer than any By the Numbers article in history.
Anyway, here are the precise number of NCAA points (absent any penalties) scored by each conference at the 2024 NCAAs.
| CONFERENCE | POINTS |
|---|---|
| Big Ten | 539 |
| Big 12 | 356.5 |
| EIWA | 172 |
| Pac-12 | 146.5 |
| ACC | 144 |
| MAC | 50 |
| SoCon | 24 |
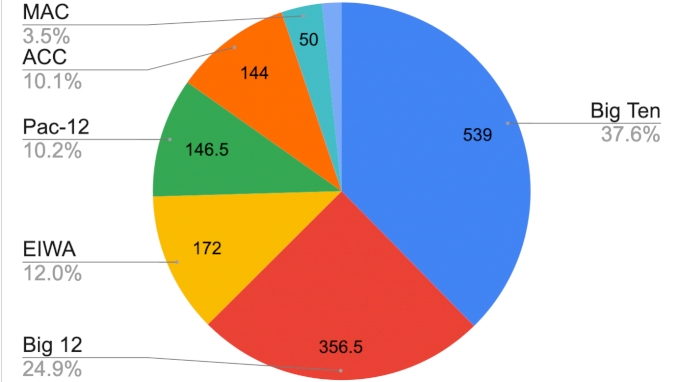
Basically the same data and takeaways as before, but now slightly more precise. And who couldn't use a little more precision in their life?
2024 NCAA Points per Conference with 2025 Alignment
There will be significant realignment next season, with the Pac-12 losing Arizona State to the Big 12 and Stanford to the ACC, and with the Ivy League sponsoring a new conference and those six teams leaving the EIWA. Taking the points earned in 2024 and attributing them to the future alignment produced the following results.
| CONF | POINTS |
|---|---|
| Big Ten | 539 |
| Big 12 | 421 |
| ACC | 178 |
| Ivy | 98 |
| EIWA | 74 |
| MAC | 50 |
| Pac-12 | 48 |
| SoCon | 24 |
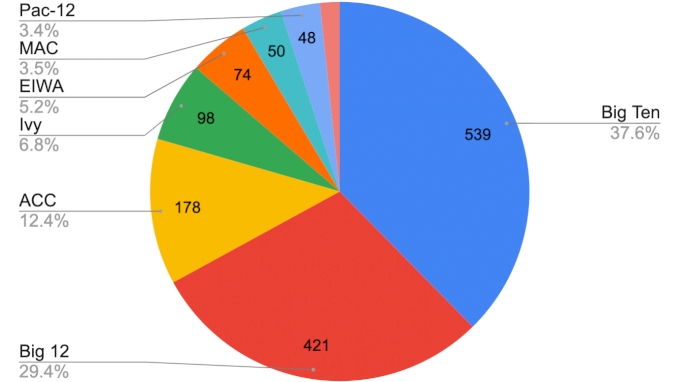
In a surprise to no one, the Big 12 and ACC will likely get stronger next season. Also, the Ivy League will be a rather formidable conference from day 1.
Now let's dig into everyone's favorite topic to argue about, NCAA performance by home state! Home states were determined by the school's athlete's bio pages. For a list of the hometowns used for each qualifier, click here.
All-Americans per Home State
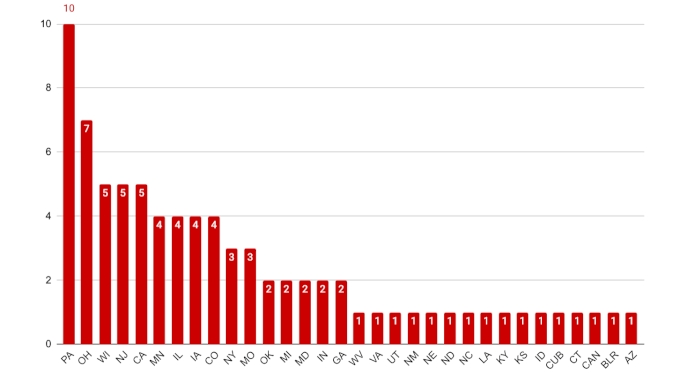
Again, very self-explanatory.
Points per Home State

Ditto.
Now, because every Pennsylvania wrestling fan demanded it...
NCAA Points per Capita
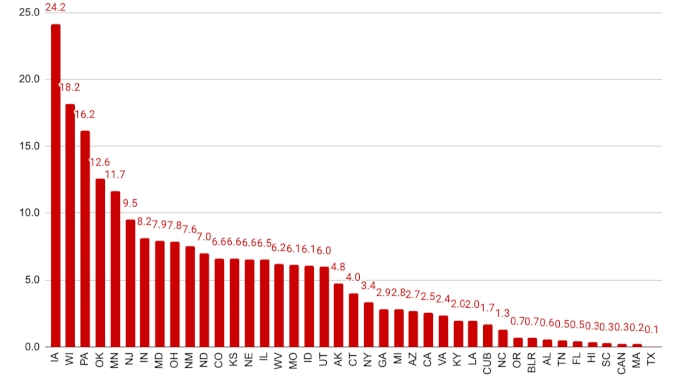
That same data (State/points/points per million/All-Americans) which I used to make that chart can be found in the table below.
| STATE | PTS/MPOP | POINTS | AAs |
|---|---|---|---|
| IA | 24.2 | 77.5 | 4 |
| WI | 18.2 | 107.5 | 5 |
| PA | 16.2 | 209.5 | 10 |
| OK | 12.6 | 51 | 2 |
| MN | 11.7 | 67 | 4 |
| NJ | 9.5 | 88.5 | 5 |
| IN | 8.2 | 56 | 2 |
| MD | 7.9 | 49 | 2 |
| OH | 7.8 | 92.5 | 7 |
| NM | 7.6 | 16 | 1 |
| ND | 7.0 | 5.5 | 1 |
| CO | 6.6 | 39 | 4 |
| KS | 6.6 | 19.5 | 1 |
| NE | 6.6 | 13 | 1 |
| IL | 6.5 | 82 | 4 |
| WV | 6.2 | 11 | 1 |
| MO | 6.1 | 38 | 3 |
| ID | 6.1 | 12 | 1 |
| UT | 6.0 | 20.5 | 1 |
| AK | 4.8 | 3.5 | 0 |
| CT | 4.0 | 14.5 | 1 |
| NY | 3.4 | 66 | 3 |
| GA | 2.9 | 31.5 | 2 |
| MI | 2.8 | 28.5 | 2 |
| AZ | 2.7 | 20 | 1 |
| CA | 2.5 | 99 | 5 |
| VA | 2.4 | 20.5 | 1 |
| KY | 2.0 | 9 | 1 |
| LA | 2.0 | 9 | 1 |
| CUB | 1.7 | 19 | 1 |
| NC | 1.3 | 14 | 1 |
| OR | 0.7 | 3 | 0 |
| BLR | 0.7 | 6.5 | 1 |
| AL | 0.6 | 3 | 0 |
| TN | 0.5 | 3.5 | 0 |
| FL | 0.5 | 10.5 | 0 |
| HI | 0.3 | 0.5 | 0 |
| SC | 0.3 | 1.5 | 0 |
| CAN | 0.3 | 10.5 | 1 |
| MA | 0.2 | 1.5 | 0 |
| TX | 0.1 | 2 | 0 |
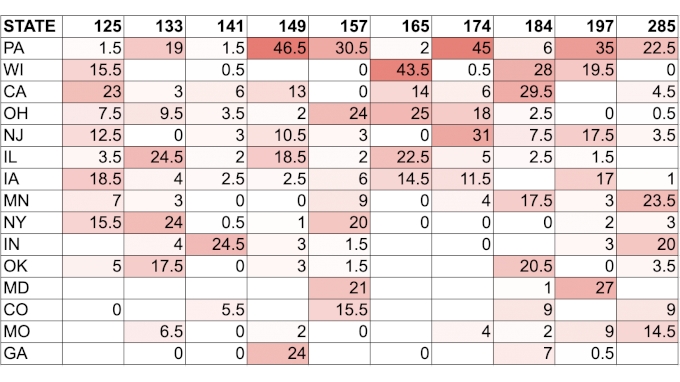
And here are the points per state broken out by weight class. Not all the states are represented in the table, however, all the states that won national champions are. The larger the number (and better a state did in that weight class), the deeper the shade of red in that cell.
NCAA Points per State by Era
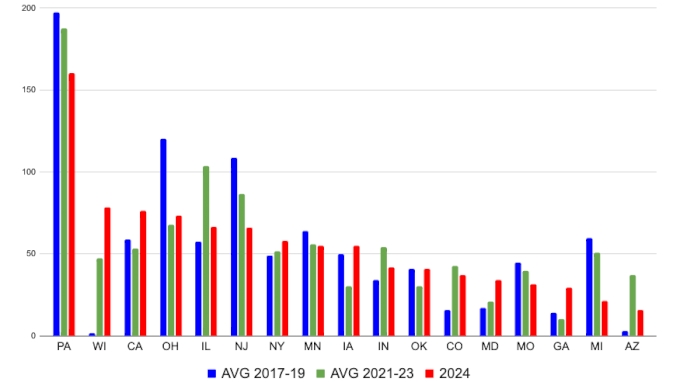
But how have states done compared to the recent past you may be asking? If you're not asking, I don't really care, I crunched the numbers already so it's going in the article.
Below are the average of placement and advancement points at NCAAs (no bonus, I only did that for this year) by state for 2017-2019 and 2021-2023, followed by this year's points (still no bonus), so we can compare for yourself (or don't compare them, no one will force you to).
| STATE | AVG 2017-19 | AVG 2021-23 | 2024 |
|---|---|---|---|
| PA | 198 | 188 | 161 |
| WI | 2 | 47 | 79 |
| CA | 59 | 53 | 77 |
| OH | 120 | 68 | 74 |
| IL | 58 | 104 | 67 |
| NJ | 109 | 87 | 66 |
| NY | 49 | 52 | 58 |
| MN | 64 | 56 | 55 |
| IA | 50 | 30 | 55 |
| IN | 34 | 54 | 42 |
| OK | 41 | 30 | 41 |
| CO | 16 | 43 | 37 |
| MD | 17 | 21 | 34 |
| MO | 45 | 40 | 32 |
| GA | 14 | 10 | 30 |
| MI | 60 | 51 | 22 |
| AZ | 3 | 37 | 16 |
The improvement of Wisconsin (to the detriment of other states) is stark! Quite the year for Wisconsinites at the NCAAs, and the future looks good too!
A graph will hopefully help illustrate that point.
We can do the same with All-Americans.
| STATE | AVG 2017-19 | AVG 2021-23 | 2024 |
|---|---|---|---|
| PA | 13.0 | 13.3 | 10 |
| OH | 9.0 | 4.7 | 7 |
| WI | 0.0 | 3.7 | 5 |
| NJ | 7.7 | 6.0 | 5 |
| CA | 4.0 | 4.7 | 5 |
| MN | 4.3 | 4.0 | 4 |
| IL | 4.0 | 7.7 | 4 |
| IA | 3.7 | 2.0 | 4 |
| CO | 1.5 | 2.7 | 4 |
| NY | 4.0 | 3.3 | 3 |
| MO | 3.3 | 3.3 | 3 |
| OK | 4.0 | 2.3 | 2 |
| MI | 4.7 | 4.0 | 2 |
| MD | 1.5 | 1.0 | 2 |
| IN | 2.7 | 3.7 | 2 |
| GA | 1.0 | 1.5 | 2 |
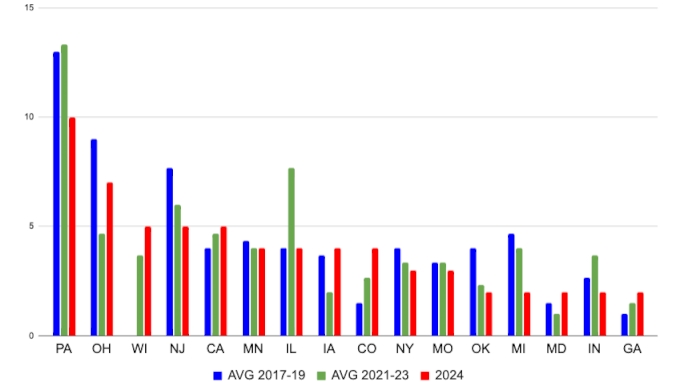
Wisconsin went from zero AAs from 2017-19 to being a top-five state in three years. Not bad!
By the way, the list of states I included in each graph was pretty arbitrary. I ranked the top states by those two metrics and just eye-balled where a logical stopping point would be. Can't include every state, wouldn't make for a quality graph!
Comparing Expected Placements Based on Rankings & Seeds
The way Flo calculates team tournament rankings throughout the regular season is by assigning placement and advancement points (but not bonus points) to each wrestler as if they placed at the NCAA tournament according to their ranking.
I used the numbers from the last set of rankings before the tournament began and compared them to the advancement and placement points each wrestler actually earned at the NCAA tournament. I did the same for the seeds.
If Flo or a seed had someone at #3 and they finished #4, that would be a difference of 1 point (12.5 instead of 13.5). If they were ranked or seeded #1 and went 0-2 or 1-2 at the tournament, that would be a difference of 20 points (20 versus 0). And so on.
I then summed up the absolute value of the difference for each weight class and have presented them below, side by side, so we can compare how well Flo and the seeds did at predicting the results of the NCAA tournament.
| WT | RANK DELT | SEED DELT |
|---|---|---|
| 125 | 104.5 | 113 |
| 133 | 51 | 53 |
| 141 | 52.5 | 49 |
| 149 | 76 | 72 |
| 157 | 66 | 47 |
| 165 | 62 | 64 |
| 174 | 44.5 | 79 |
| 184 | 43.5 | 48 |
| 197 | 50 | 58 |
| 285 | 60 | 72 |
| TOTAL | 610 | 655 |
No surprise that neither the rankings nor seeds were perfect for any weight class. Far from it!
Also no surprise that the rankings and seedings did a similar job of predicting NCAA placements, though perhaps there is a slight surprise that Flo's rankings were slightly more accurate than the seeds!
Not by a lot, though. The main difference was Flo had Carter Staorocci ranked #1 (or 20) points, where as he was seeded #9 (2 points). Since Starocci finished first, Flo was '18 points' more accurate than the seed.
Flo's rankings were also slightly more accurate at 285, where six of the eight All-Americans were ranked in Flo's top eight.
Additionally, we see more evidence of 125 being the most chaotic and least predictable weight class -- as if more evidence was needed -- as both rank and seed were pretty far off the mark.
At Last: Heat Maps
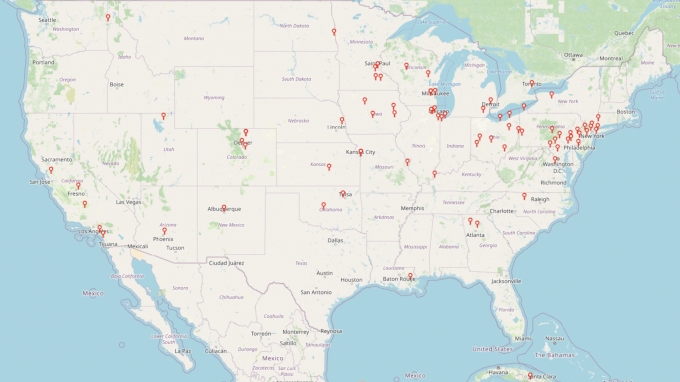
For our first map, I've taken the locations of every qualifier's hometown and clustered them, so as to highlight the high-density areas of wrestling talent. The numbers in each pin represent the number of qualifiers from towns in close proximity to the pin (exactly how close and where the pin goes is up to the software I'm using).

Apologies for cropping out our three Alaskans (Bockman, Hopkins and Hopkins), our two Cubans (Echemendia and Bastida), our Hawaiin (Terukina) and our Belarussian (Slavikouski) qualifiers. If I zoomed out any further the map would be completely unreadable. And apologies for not being able to make those numbers in the clusters any bigger. Look, you can't win them all!
Next a map of all the All-Americans (minus Slavikouski -- apologies a second time!).
And here we have a map of all ten champs.

From left to right you've got Figueroa, Kerkvliet, Keckeisen, Mendez, Henson, Carr, Starocci, Brooks, Haines and Arujau.
Finally, our pièce de résistance, a heat map based on NCAA points scored and hometowns.
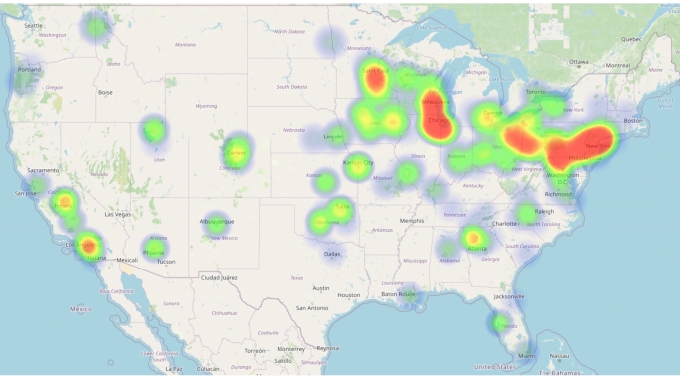
Of just the contiguous 48, though. Sorry again to everyone I had to crop out!
That's all for 2024. See you next year in Philly!
Related Content
 153-E lbs Consi Of 8 #1 - Blake Haliburda, MI vs Cody Salomon, VA
Apr 27, 2024
 150 lbs Round 3 (6 Team) - Talon Maple, Funky Monkey vs Logan Acri, Beebe Trained Silver
Apr 27, 2024
 M 80 lbs Consi Of 8 #2 - Nikkoh Traynham, Elmira vs Ethan Wallach, Sherburne
Apr 27, 2024
 42-43.8 lbs Rr Rnd 1 - Lawson Chapman, JET Wrestling vs Thomas Price, JET Wrestling
Apr 27, 2024
 139-E lbs Semifinal - Mars Coste, WV vs Tyler Roark, WV
Apr 27, 2024
 146-E lbs Semifinal - Holden Huhn, OH vs Anthony Orlandini, PA
Apr 27, 2024
 48 lbs Round 4 (6 Team) - Kellan Dedmon, Killer Elite vs Evan Hill, Misfits United
Apr 27, 2024
 144 lbs Round 3 (6 Team) - James Kosza, Funky Monkey vs Raymond Cavey, Beebe Trained Silver
Apr 27, 2024
 60 lbs Round 4 (6 Team) - Ava Margolis, Cocoa Beach WC vs Lincoln Arfaras, Black Hive WC
Apr 27, 2024