Peaking For NCAAs: Which Coach Does It Best? (Part 2)
Peaking For NCAAs: Which Coach Does It Best? (Part 2)
By Andrew SpeyIn part one of our in-depth analysis on whether certain coaches are better at priming their athletes for peak performances, we evaluated how w
By Andrew Spey
In part one of our in-depth analysis on whether certain coaches are better at priming their athletes for peak performances, we evaluated how wrestlers seeded No. 12 through 9 performed at NCAAs.
We limited that study specifically to teams who maintained the same head coach in the last 16 years. We found some teams did better than others regarding expectations based on seeds But what we were unable to pin down (pun very much intended, thank you), was if any of those coaches are better at preparing their athletes to peak than others.
Despite not identifying clear evidence of coaching skill related to peaking, the actual results were interesting enough to warrant additional analysis, so today we will make some adjustments to the study and look at a larger contingent of coaches.
Conspicuously absent from part one’s analysis were superstar coaches Cael Sanderson and Tom Brands, and their respective programs, Penn State and Iowa. They were excluded because neither coach maintained the requisite tenure. We will remedy these omissions with today’s examination.
The Hypothesis
Our hypothesis remains as before: that certain Division I NCAA wrestling coaches help their wrestlers perform better at the NCAA tournament compared to other coaches. But let’s not get too hung up on on the hypothesis for the time being and just see what happens when we run a new set of numbers.
The Data
To include both Sanderson and Brands as test subjects, we trimmed our requirements for coaching tenure from 16 years to seven. Shortening the timeframe increased the chances of running into small-sample-size problems. Fewer years mean fewer wrestlers with 12-9 seeds; fewer wrestlers mean less data; therefore, less-reliable findings. To adjust for this, we included wrestlers ranked seventh and eighth, as well as 12th through ninth.
Thirteen individuals have been the head coach of a Division I program for the last seven years and also shepherded no fewer than 13 wrestlers with seeds ranging from 12 to seven through the NCAA tournament during that timeframe. Those coaches are our subjects, and the performances of their national qualifiers is the data we examined to test our hypothesis.
New Criteria, New Cohort of Coaches:
J Robinson - Minnesota - 21 wrestlers
John Smith - Oklahoma State - 17 wrestlers
Mark Manning - Nebraska - 17 wrestlers
Tom Borrelli - Central Michigan - 15 wrestlers
Joe McFarland - Michigan - 14 wrestlers
Tom Brands - Iowa - 14 wrestlers
Pat Santoro - Lehigh - 13 wrestlers
Kevin Dresser - Virginia Tech - 12 wrestlers
Cael Sanderson - Penn State - 12 wrestlers
Tom Ryan - Ohio State - 11 wrestlers
Jim Heffernan - Illinois - 11 wrestlers
Steve Garland - Virginia - 10 wrestlers
Brian Smith - Missouri - 10 wrestlers
Please note some coaches did not make the cut for our analysis because of an insufficient number wrestlers with 12-7 seeds. For example, Rob Koll coached 59 athletes in the last seven NCAA tournaments, but only nine of them were seeded 12 through seven. This is not an indictment on coaching ability in any way (we all know Rob Koll can coach); it's merely a random result of somewhat arbitrary parameters.
The Analysis
As in our previous analysis, we ignored higher seeds, as examining the results of national qualifiers receiving the highest seeds would bias the results. With no place left to go but down, coaches with a preponderance of top-seeded wrestlers would be punished with a disproportionate number of "negative" results.
To see how well our coaches are able to extract peak performances from their wrestlers, we examined the results of their national qualifiers seeded 12th, 11th, 10th, ninth, eighth and seventh over the last seven NCAA tournaments.
As before, we recognize there are no perfect NCAA seeds—an opinion vehemently reinforced every March when the tournament seeds are first announced—but theoretically, those seeds that are too low should balance out the seeds that are too high, and the analysis should not be adversely affected by "incorrect" seeding.
A chart of all our test subjects’ programs and the number of wrestlers who received 12-7 seeds over the last seven years can be found below.
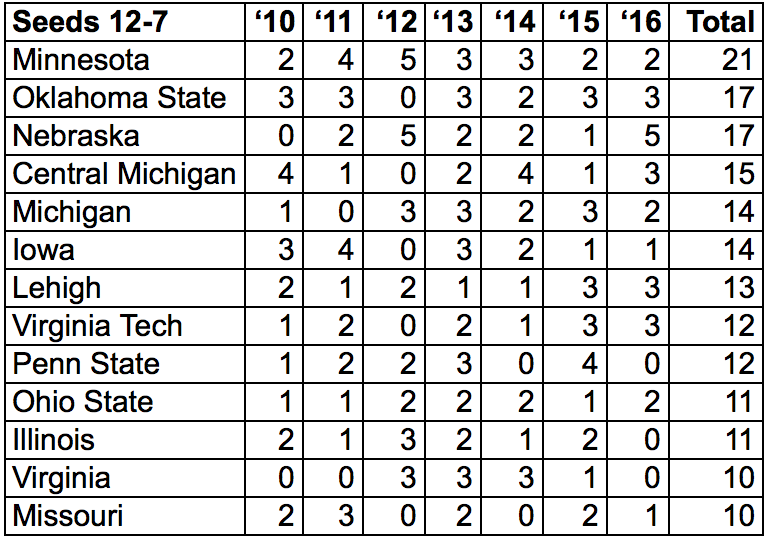
We filtered the results by NCAA finish, and assigned point values to each wrestler’s specific placement using the same scale as in part one:
| R32: | -3 |
| R24: | -2 |
| R16: | -1 |
| R12: | 0 |
| 8th: | 1 |
| 7th: | 2 |
| 6th: | 3 |
| 5th: | 4 |
| 4th: | 5 |
| 3rd: | 6 |
| 2nd: | 7 |
| 1st: | 8 |
The Findings
The resulting scores of each program's wrestlers seeded 12 through seven over the last seven years according to our scoring scale are below:
| Minnesota | 36 |
| Penn State | 24 |
| Virginia Tech | 20 |
| Illinois | 18 |
| Oklahoma State | 15 |
| Lehigh | 15 |
| Ohio State | 14 |
| Nebraska | 11 |
| Iowa | 9 |
| Central Michigan | 7 |
| Michigan | 3 |
| Missouri | 0 |
| Virginia | -5 |
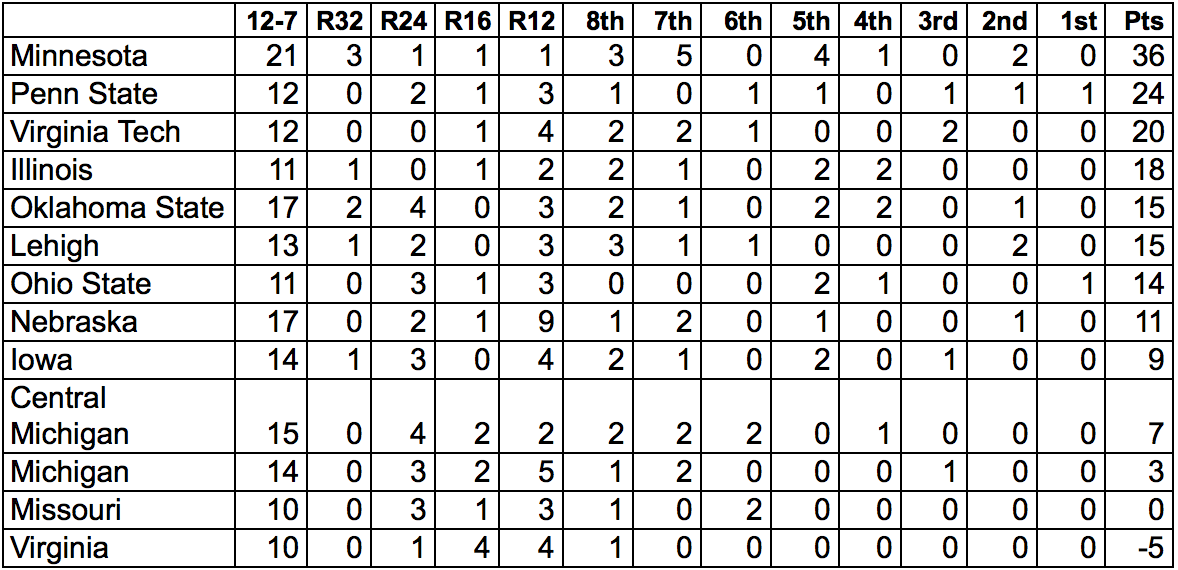
In our battle of the super coaches, there is a clear victor, and perhaps surprisingly, it's neither Sanderson nor Brands—it's JRob. But if we're just considering the duel between Cael and Tom, we also have a demonstrative winner: the Penn State skipper.
But the case is far from closed. We are only looking at seven years of data, and as the results from part one can tell us, we can expect those results to regress toward the mean over a longer period of time. To shed more light on what these new numbers might imply, we can try looking at the data through a few more lenses.
Retesting the Data
To get a better feel of how our coaches compare to the rest of the NCAA, we can run every Division I program that had any wrestlers seeded 12-7 in the past seven tournaments through the same point-scoring exercise.
That chart is below.
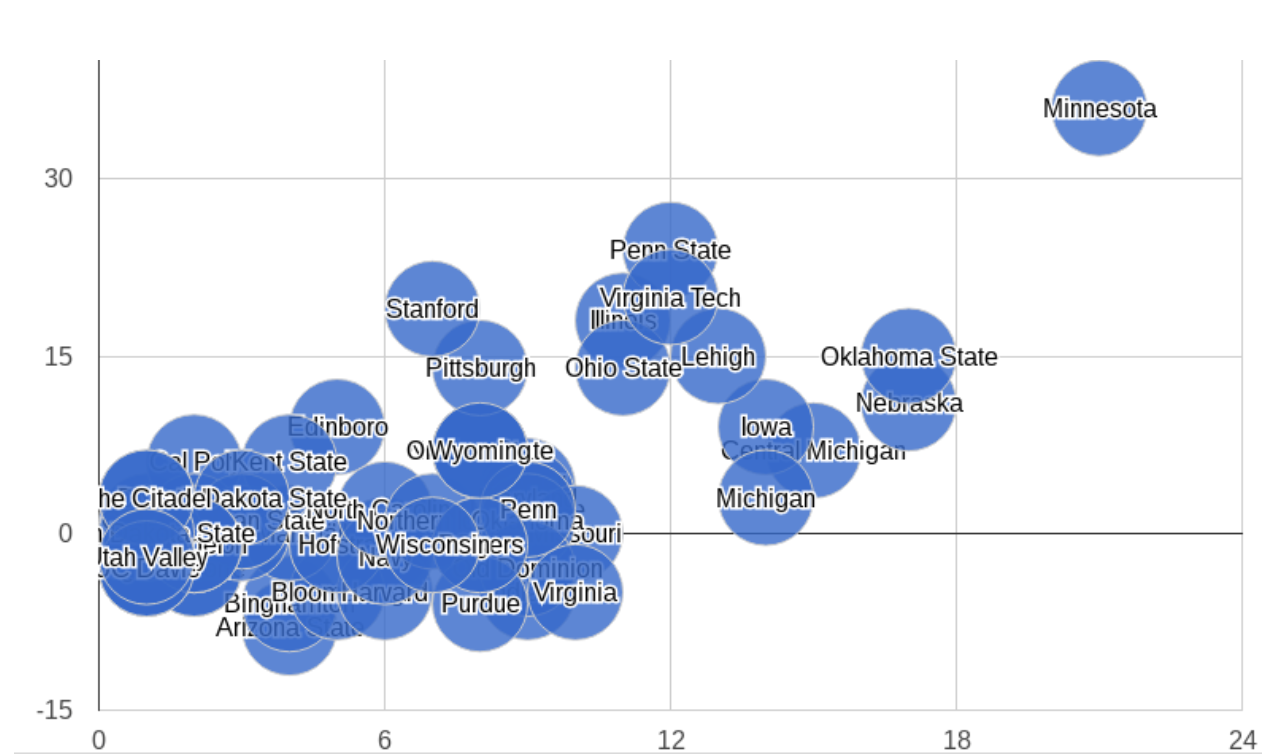
The total number of 12-7 seeded wrestlers over the last seven years is plotted on the horizontal X-axis and the total score of the programs is on the vertical Y-axis.
Now, let’s look at the same scatter plot, but without the labels and with the addition of a trendline.
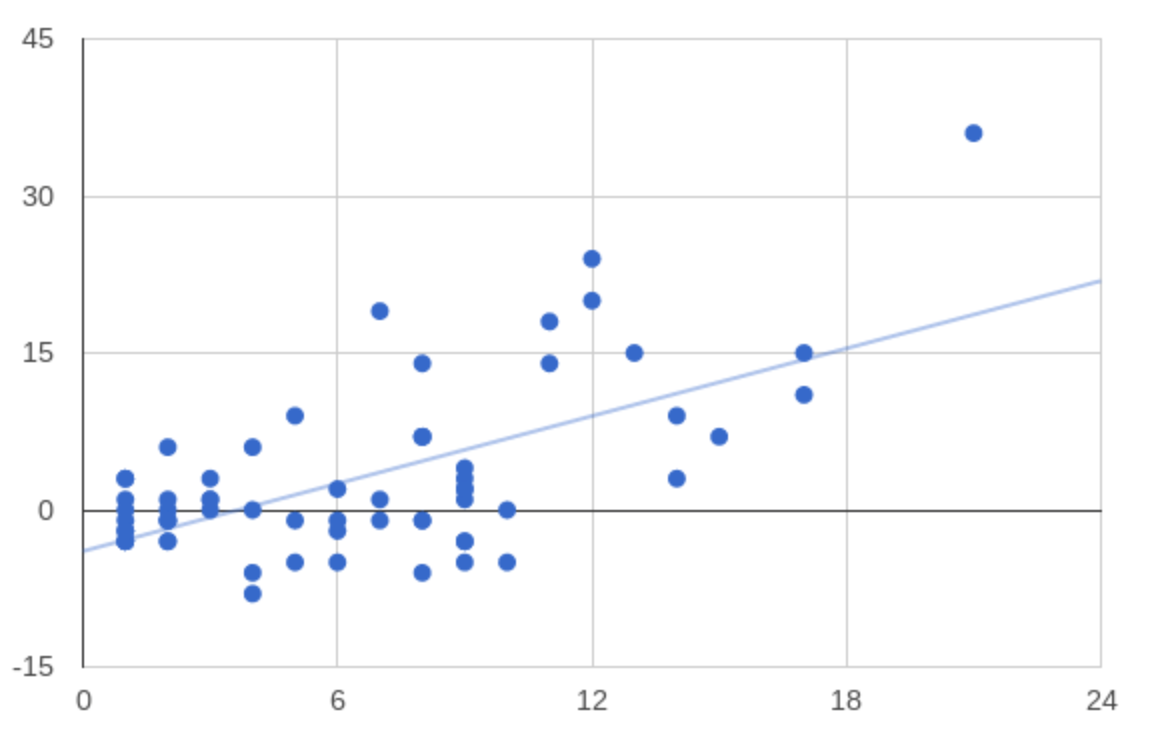
Minnesota’s results immediately stand out. Even with the expected rise in score due to having more qualifiers seeded 12-7 than anyone else, JRob has his Gophers well out in front of the competition.
So, is it time to crown JRob and his already-golden Gophers?
Preliminary Conclusions
Before JRob ascends the Resilite Throne, we need to restate the concerns regarding small sample size. Minnesota was not such an outlier over 16 seasons, so being any outlier in only seven seasons would imply a large dose of naturally occurring variance and not necessarily skill.
Moreover, at this point, we can consider our hypothesis moot, as we are no closer than before to identifying a peaking skill for coaches, which is to say, not at all. But just allowing the numbers to speak for themselves, we have discovered that over that last seven years, JRob has gotten some tremendous performances out of his Minnesota wrestlers.
The same can be said for Cael Sanderson and Kevin Dresser. In fact, all our coaches except Brian Smith and Steve Garland were able to coax a top-four finish from at least one wrestler seeded seventh or lower, which is not to say that the Tigers and Cavaliers are destined to underperform. We’ve only unearthed the entirely obvious notion that Smith and Garland likely wish they could have had another crack at the tournament with some of their athletes.
Additional Analysis
Less for its implications to our mooted hypothesis and more because it’s fun information and more fuel for the coaching debate, we reexamined our new data from the perspective of "Success" and "Failure Rates."
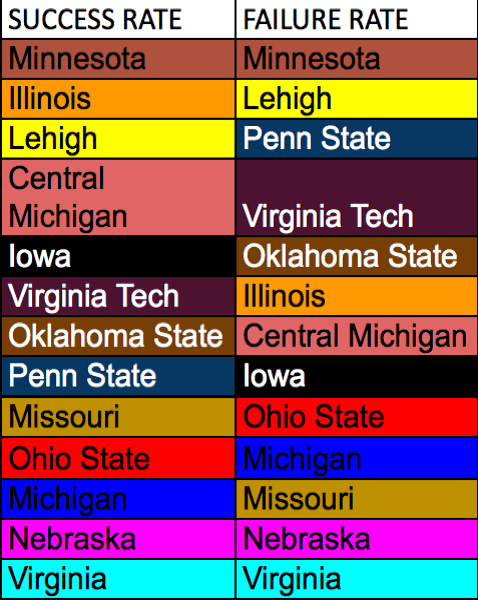
For the "Success Rate," we considered 12-9 seeds (leaving out the seven and eight seeds, in this case). We divided the number of 12-9 seeds that reach All-American status by the total number of 12-9 seeds over the last seven years. The results below show: school - total number of 12-9 seeds - AA by those seeds - ‘Success Rate’.
| 'Success Rate' | |||
|---|---|---|---|
| Minnesota | 14 | 8 | 57.10% |
| Illinois | 6 | 3 | 50.00% |
| Lehigh | 10 | 5 | 50.00% |
| Central Michigan | 11 | 5 | 45.50% |
| Iowa | 10 | 4 | 40.00% |
| Virginia Tech | 5 | 2 | 40.00% |
| Oklahoma State | 13 | 5 | 38.50% |
| Penn State | 8 | 3 | 37.50% |
| Missouri | 9 | 3 | 33.30% |
| Ohio State | 10 | 3 | 30.00% |
| Michigan | 9 | 2 | 22.20% |
| Nebraska | 9 | 2 | 22.20% |
| Virginia | 6 | 0 | 0.00% |
| 'Failure Rate' | |||
|---|---|---|---|
| Minnesota | 21 | 5 | 23.80% |
| Lehigh | 4 | 1 | 25.00% |
| Penn State | 11 | 3 | 27.30% |
| Virginia Tech | 13 | 4 | 30.80% |
| Oklahoma State | 12 | 4 | 33.30% |
| Illinois | 8 | 3 | 37.50% |
| Central Michigan | 5 | 2 | 40.00% |
| Iowa | 20 | 8 | 40.00% |
| Ohio State | 7 | 3 | 42.90% |
| Michigan | 9 | 4 | 44.40% |
| Missouri | 6 | 3 | 50.00% |
| Nebraska | 9 | 6 | 66.70% |
| Virginia | 7 | 5 | 71.40% |
The correlation is perhaps best displayed by a side-by-side, color-coded comparison of the programs—see below.
Final Conclusion
Our hypothesis has not been confirmed, but the study wasn't entirely without value.
For example, we have a new way to compare Cael Sanderson to Tom Brands. Here, the pride of State College, Pennsylvania, can claim another victory.
What's more surprising is how far ahead Coach Robinson and Minnesota are. By all measures, the Gophers have been superior at exceeding expectations. Fans may want to reconsider that before they cast aspersions on Minnesota’s season-ending performances.
On the other hand, I would not be so foolish as to suggest that Cael’s Nittany Lions have somehow conversely performed suboptimally over the last seven years simply because they do not rank first in these particular analyses. Five championships in seven years speak for themselves, expectations notwithstanding.
Also worth mentioning is although our results suffer from concerns of small sample size, Minnesota’s achievements are not dependent on one or two flukes. Two of JRob’s wrestlers in the last seven years reached the finals from a 12-7 seed. Take one of those results away, and Minnesota would still lead Penn State by five points, according to our scoring rubric.
Combine that with Minnesota being the leader in both the "Success" and "Failure Rate" rankings, and we have a solid case for the Gophers exceeding expectations, on average, over the last seven NCAA tournaments.
But no data ever tells the complete story, no matter how finely parsed, and the debate is far from settled. No doubt, the numbers here will challenge certain prior assumptions of some folks who will remain unpersuaded by any of our results. That’s to be expected, and part of the fun, never-ending debate in college sports.
The Bottom Line
We are also no closer to determining if a peaking skill among coaches exists, but we have settled one Penn State vs. Iowa battle in favor of the Nittany Lions. Additionally, we can say with some degree of confidence that Minnesota has been doing quite well in regard to expectations based on NCAA tournament seeds over the last seven years.
We’ve done this by taking a snapshot of 13 teams over seven years and learning more than we did before. But what we do not have is a holistic review of the programs involved, and how they fared in regard to their ultimate expectations set each year on their respective campuses. But if this article does nothing more than pique one’s interest for further studies, than it is safe to call it a mission accomplished.
Popular Right Now
Freshman, #1 Ranked Adam Busiello Verbals
Will Aaron Pico Wrestle Again?
Russian Wrestlers Hanging Out In PED Testing Lab
D1 Lineup Look: Arizona State
The Worst Wrestling Match Of All Time