By The Numbers: 3rd Coaches Poll
By The Numbers: 3rd Coaches Poll
A deep dive into the most recent rankings courtesy of the NCAA coaches.

The third NCAA Coaches Poll and second RPI rankings are out (as are the NCAA Tournament allocations). This means we can dig into the coaches' poll rankings and create some cool tables and charts based on those rankings!
The following table is how the 2024 NCAA Tournament will go based on projections from the Second Coaches Poll, using the same methodology as our Team Tournament Rankings, where a ranking equals a placement, which is then used to calculate advancement and placement points at the NCAAs. As such, no bonus points are factored in.
| Projected Place | Team | Porjected Points |
|---|---|---|
| 1 | Penn State | 133 |
| 2 | Iowa | 65 |
| 3 | NC State | 58.5 |
| 4 | Nebraska | 56 |
| 5 | Iowa State | 55 |
| 6 | Lehigh | 54.5 |
| 7 | Michigan | 54 |
| 8 | Cornell | 52.5 |
| 9 | Oklahoma State | 51.5 |
| 10 | Virginia Tech | 46.5 |
| 11 | Missouri | 43.5 |
| 12 | Arizona State | 40 |
| 13 | South Dakota State | 34 |
| 14 | Ohio State | 30.5 |
| 15 | Northern Iowa | 30 |
| 16 | Wisconsin | 29.5 |
| 17 | Minnesota | 27 |
| 18 | Purdue | 20.5 |
| 19 | Northern Colorado | 19.5 |
| 19 | Air Force | 19.5 |
| 21 | West Virginia | 14 |
| 21 | Oregon State | 14 |
| 23 | Maryland | 12.5 |
| 23 | Little Rock | 12.5 |
| 25 | Rutgers | 11.5 |
| 25 | Oklahoma | 11.5 |
| 27 | North Carolina | 11 |
| 27 | Binghamton | 11 |
| 29 | Stanford | 10.5 |
| 29 | Harvard | 10.5 |
| 31 | Pennsylvania | 9.5 |
| 32 | Pittsburgh | 7.5 |
| 33 | Cal Poly | 6.5 |
| 34 | Illinois | 5.5 |
| 35 | Indiana | 4 |
| 35 | Campbell | 4 |
| 37 | Ohio | 3.5 |
| 37 | Navy | 3.5 |
| 39 | Michigan State | 3 |
| 39 | Army West Point | 3 |
| 41 | Princeton | 2.5 |
| 42 | Wyoming | 2 |
| 42 | Lock Haven | 2 |
| 42 | Columbia | 2 |
| 42 | Central Michigan | 2 |
| 42 | Bucknell | 2 |
| 47 | Virginia | 1.5 |
| 47 | Utah Valley | 1.5 |
| 47 | Appalachian State | 1.5 |
| 50 | SIU Edwardsville | 0.5 |
| 50 | Northwestern | 0.5 |
| 50 | North Dakota State | 0.5 |
| 50 | Hofstra | 0.5 |
| 50 | George Mason | 0.5 |
| 50 | Franklin & Marshall | 0.5 |
| 50 | Cleveland State | 0.5 |
| 57 | Rider | 0 |
| 57 | Northern Illinois | 0 |
| 57 | Gardner-Webb | 0 |
| 57 | Drexel | 0 |
| 57 | Clarion | 0 |
| 57 | Chattanooga | 0 |
| 57 | California Baptist | 0 |
| 57 | Buffalo | 0 |
| 57 | American | 0 |
For a visualization of just how impressive that score is for Penn State, check out this pie chart of each school's share of the total points earned at the NCAAs.
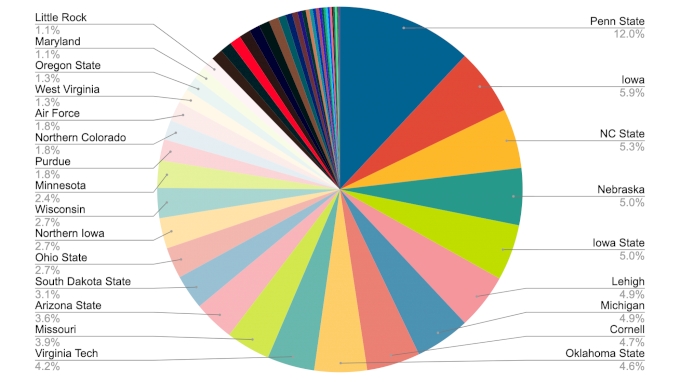
For reference, 10 champs would be 200 points, or about 18% of the total available points. Penn State is projected to earn 12% of the total possible points.
We can also count how many All-Americans the coaches are projecting for each school by adding up all the wrestlers ranked in the top eight by team.
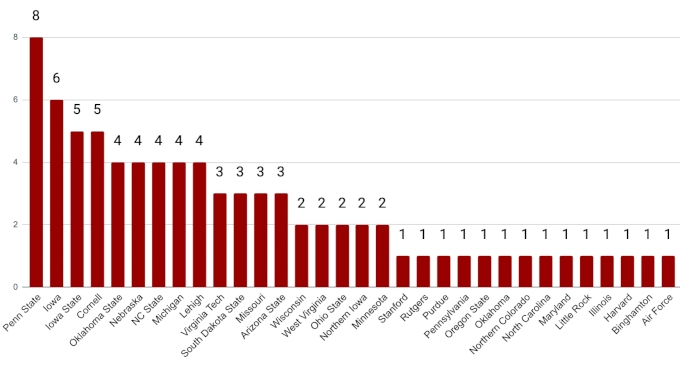
If that chart is hard to read here are the same numbers in a (hopefully) easier-to-read table.
| Team | AAs | Team | AAs | Team | AAs |
|---|---|---|---|---|---|
| Penn State | 8 | Missouri | 3 | Oregon State | 1 |
| Iowa | 6 | Arizona State | 3 | Oklahoma | 1 |
| Iowa State | 5 | Wisconsin | 2 | Northern Colorado | 1 |
| Cornell | 5 | West Virginia | 2 | North Carolina | 1 |
| Oklahoma State | 4 | Ohio State | 2 | Maryland | 1 |
| Nebraska | 4 | Northern Iowa | 2 | Little Rock | 1 |
| NC State | 4 | Minnesota | 2 | Illinois | 1 |
| Michigan | 4 | Stanford | 1 | Harvard | 1 |
| Lehigh | 4 | Rutgers | 1 | Binghamton | 1 |
| Virginia Tech | 3 | Purdue | 1 | Air Force | 1 |
| South Dakota State | 3 | Pennsylvania | 1 |
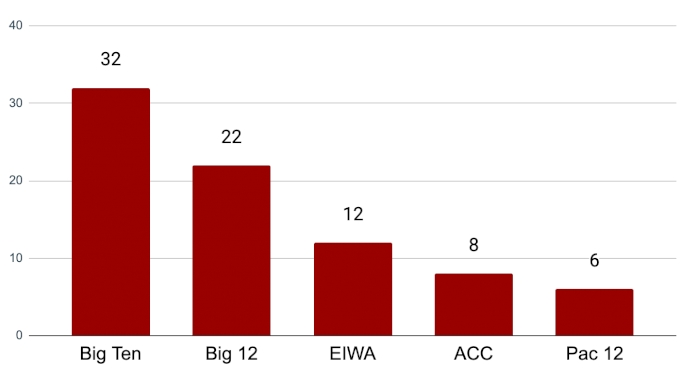
We can also look at projected All-Americans by conference.
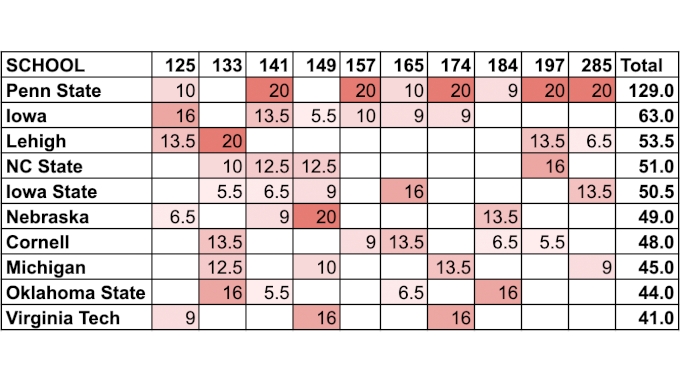
Finally, we can do a projected points scored at NCAA matrix using teams and weight classes.